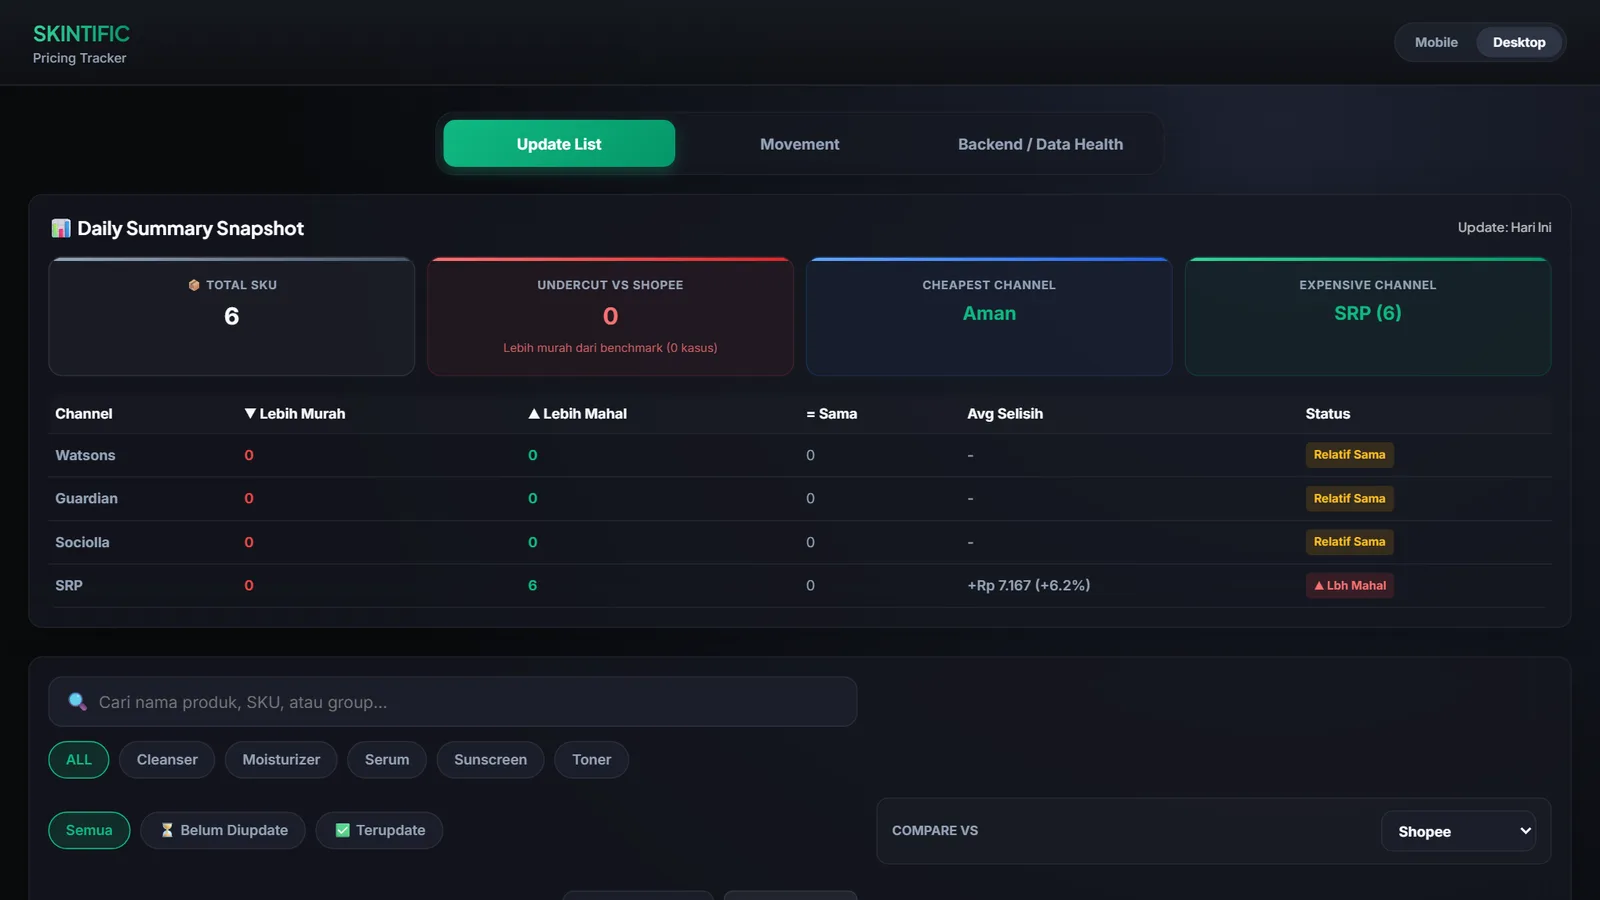
Snapshot
This internal tool automates new product development (NPD) price tracking for Skintific. It captures each SKU’s price per channel every day — Shopee online plus Watsons, Guardian, and Sociolla offline — compares prices against the target SRP, and presents the result in a dashboard so the commercial team can see undercut SKUs and channel gaps at a glance instead of compiling prices by hand.
The situation
New products launch across several channels at once, each with its own pricing. Keeping launch prices aligned to the target SRP required someone to open each channel, record the price per SKU, and flag anything off — a repetitive daily task that scaled poorly as the SKU list grew and was easy to get wrong.
The problem
- Manual daily checks. Recording prices per SKU per channel by hand was slow and error-prone.
- No single view. Online and offline prices lived in different places, so cross-channel gaps were hard to see.
- Late detection. SKUs priced below the target SRP were often found after the fact, not the same day.
What I built
A Google Apps Script application with a Sheets store and an HtmlService dashboard:
- Daily price snapshot. A time-driven trigger captures each SKU’s price per channel into a historical store every day, so trends and drops are visible over time.
- NPD daily board. A per-SKU × per-date price matrix built from the historical store, so the team can scan a whole category’s pricing trajectory in one table.
- Multi-channel comparison. The dashboard surfaces online (Shopee) versus offline (Watsons, Guardian, Sociolla) prices, computes offline averages, and compares them to the target SRP — flagging SKUs priced below benchmark.
- Product tracking registry. Each tracked product carries brand, category, launch date, and target SRP, with a status the commercial team can manage.
- Summary snapshot. A daily summary highlights total SKUs, undercut count versus Shopee, and the cheapest and most expensive channels.
// Sanitized: a daily trigger snapshots each SKU's channel prices into history.
function runDailyFlow() {
  const products = getTrackedProducts();          // SKU registry
  const snapshot = products.map(p => ({
    sku: p.sku,
    date: today(),
    shopee: fetchChannelPrice(p, 'shopee'),
    watson: fetchChannelPrice(p, 'watson'),
    guardian: fetchChannelPrice(p, 'guardian'),
    sociolla: fetchChannelPrice(p, 'sociolla')
  }));
  appendToHistory(snapshot);                      // historical store
  rebuildDailyBoard();                            // per-SKU x per-date matrix
}
Technical patterns
- Append-only history. Daily snapshots accumulate, so the same store powers both the latest board and trend analysis without recomputation.
- Recovery utilities. Backfill and repair functions restore missing snapshots, keeping the board accurate after source changes or failures.
- Scheduled automation. A time-driven trigger runs the whole flow unattended; the dashboard reads the results without manual refresh.
Outcome
Daily price tracking moved from a manual task to an automated snapshot, cross-channel gaps became visible in one dashboard, and SKUs priced below benchmark are flagged the same day for commercial follow-up. Specific SKU counts and pricing figures are withheld as internal.
What I learned
The value of an operational tool is reliability over features. The dashboard only earned trust once the snapshot ran unattended every day and the recovery utilities kept the history complete — teams act on a number only when they are confident it is current.