FM/QUERY PORTFOLIO

Type help for commands or search nine case studies.

← Work index / Future Creative Network (Maleo)

Professional Experience Marketing and creative analytics

Social Media Analytics and Reporting Automation

Led 30+ client-facing reports and strategy decks while building a repeatable social-media analytics pipeline from multi-platform data into automated spreadsheets, KOL scrapers, and BI dashboards.

Published with protected details
Campaign monitoring dashboard for a SilverQueen campaign, recreated with synthetic data, showing actual-vs-KPI gauges, a track score, and best-performing content
Organization
Future Creative Network (Maleo)
Role
Data Analyst
Timeline
June 2025–June 2026
Stack
ClickHouse · Apps Script · Python · PostgreSQL · MySQL · TablePlus · Google Sheets · Looker Studio · Tableau · Metabase
My role

My contribution.

Work I directly owned or delivered within the broader team effort.

  1. 01

    Led data preparation, analytical framing, insight synthesis, and production for 30+ recurring, ad hoc, and pitch reports and decks.

  2. 02

    Designed end-to-end analytics workflows from KPI definition through reporting across digital platforms.

  3. 03

    Built and maintained multi-source automated pipelines, dashboards, and scheduled reporting outputs.

  4. 04

    Developed an AI-assisted daily performance nudge and supported client-facing insight and pitch work.

Analysis frame

Assumptions / constraints

  • Reporting spans at least five social platforms, with four FMCG brands anchoring the recurring analytics workload and additional approved samples showing broader client output.
  • Published figures are limited to approved report and dashboard evidence; raw records and sensitive commercial details remain unavailable.
  • Automation depends on stable KPI definitions, freshness checks, ownership, and escalation paths.

Technical judgment

Decision log

  1. 01
    Build a maintained multi-source pipeline from ClickHouse into spreadsheets, reports, and BI dashboards.Why

    Raw data was scattered across tools and analysts were spending time on manual preparation.

  2. 02
    Standardize reusable extraction, transformation, and scheduled-reporting patterns.Why

    The next analyst needed to rerun workflows without reverse-engineering individual scripts.

  3. 03
    Surface actual-versus-KPI gauges, track scores, distributions, and best-performing content in BI.Why

    Marketing stakeholders needed recurring decision signals instead of manually compiled weekly slide decks.

Selected 2025 brand reports

Three reports. Different decision contexts.

Three representative performance reports from a broader client portfolio, selected to show how recurring analysis moved from channel results to decision-ready recommendations. These examples represent only part of the broader portfolio handled during the engagement.

Report / 01February–October 2025

Social media monitoring report

CONCERTO

Evaluated KPI achievement across reach, engagement, paid clicks, impressions, follower growth, and publishing activity.

total reach
9.16M102% of a 9.0M KPI
total engagements
34,869273% of engagement KPI
paid clicks
4,964175% of paid-click KPI
Analytical read

Engagement and paid-click KPIs materially outpaced plan, while impressions and follower acquisition remained below target and required a different optimization response.

My contribution

Consolidated performance data, evaluated KPI achievement, identified content and format patterns associated with performance, and translated findings into recommendations for the next reporting cycle.

Scope note - Data was cut off in October; this is not a full-calendar-year result.

Report / 02January–September 2025

Owned social media report

BlueBand Professional

Analyzed Instagram and LinkedIn performance against competitor and industry benchmarks.

Instagram engagements
9,611highest total in the report’s three-brand benchmark
Instagram follower additions
5,479report-stated growth of 15.31%
LinkedIn engagements
521across 11 posts, averaging 47 per post
Analytical read

Instagram led the benchmark on total engagement, while LinkedIn needed a distinct editorial role rather than a direct reuse of consumer-channel content.

My contribution

Combined owned-channel analysis with competitive benchmarking and developed recommendations around practical recipes, chef-led communication, and business-value storytelling.

Scope note - Core report scope ends in September; a separate October TikTok appendix is excluded from these headline metrics.

Report / 03January–October 2025

Performance recap

SilverQueen

Separated campaign, paid, organic, and competitive views across Instagram and TikTok to distinguish visibility from channel health.

campaign reach
26.1MBanyak Makna Cinta, the strongest campaign contributor
Instagram followers
166,949net growth of 8,692 during the comparison period
TikTok followers
84,728net growth of 4,942 during the comparison period
Analytical read

The report classified Instagram visibility gains under paid activity, while softer organic engagement and slowing TikTok follower momentum pointed to a need for stronger native, initiative-led content.

My contribution

Structured cross-channel performance and competitor views, diagnosed paid-versus-organic movement, and converted the findings into channel-specific recommendations.

Scope note - The report classified most large Instagram visibility gains under paid activity rather than organic performance.

Performance figures are brand- or campaign-level outcomes observed during the engagement and reflect broader content, media, account, and client execution.

Campaign monitor / 2026

KPIs made operational.

Separate from the 2025 report studies, these selected dashboards show how campaign targets, channel contribution, and performance gaps were made visible for ongoing decisions.

Campaign / Festive Ramadan 2026

BlueBand

TikTok performance materially exceeded the campaign’s visible reach, impression, and engagement targets.

Impressions44.5MKPI 409.6K108.7× target
Reach27.0MKPI 359.2K75.2× target
Engagements87.7KKPI 3.84K22.8× target

Visual bars are capped for readability; attainment labels show the full multiple against target.

Built for decisions

Built a channel-level monitoring view with actual-versus-KPI gauges, content rankings, and submission tracking.

Validation note

Actuals and targets are shown together because high achievement ratios depend heavily on the campaign KPI denominator.

Decision signal ready

Campaign / Festive Ramadan 2026

BlueBand Professional

The same monitoring frame surfaced both metrics above target and gaps requiring follow-up.

Impressions88,446105.29% attainment88,446 actual - 84,000 target - 105.29% attainment
Follower additions1,583104.14% attainment1,583 actual - 1,520 target - 104.14% attainment
Reach48,32176.70% attainment48,321 actual - 63,000 target - 76.7% attainment
Built for decisions

Built a decision view that made overperformance and underperformance legible in the same campaign snapshot.

Validation note

A submission-activity percentage with no clear visible actual is excluded from this evidence.

Decision signal ready

Campaign / Lovefest 2026

SilverQueen

Monitored total campaign delivery, KPI attainment, phase contribution, channel mix, and paid-media performance.

Impressions76.5%TikTok contributionTikTok 76.5%Instagram 23.5%
Reach73.9%TikTok contributionTikTok 73.9%Instagram 26.1%
Engagement71.4%TikTok contributionTikTok 71.4%Instagram 28.6%
Built for decisions

Built a multi-level dashboard connecting overall delivery to phase, channel, content, and paid-performance views.

Validation note

A displayed reach achievement and one Always On percentage were inconsistent with visible components, so both are excluded here.

Decision signal ready

Additional approved work

More reporting evidence.

30+decks & reports led

Lead Analytics Author. Eight additional approved previews from recurring retainers and ad hoc analytical work, shown as a broader sample beyond the detailed evidence above.

Red cover of the SilverQueen April 2026 monthly social media report

SilverQueenMonthly retainer2026

SilverQueen Monthly Report — April 2026

BlueBand Ramadan campaign deck cover showing a family preparing food

BlueBandAd hoc2026

KPI Activity Add Yours Ramadan 2026

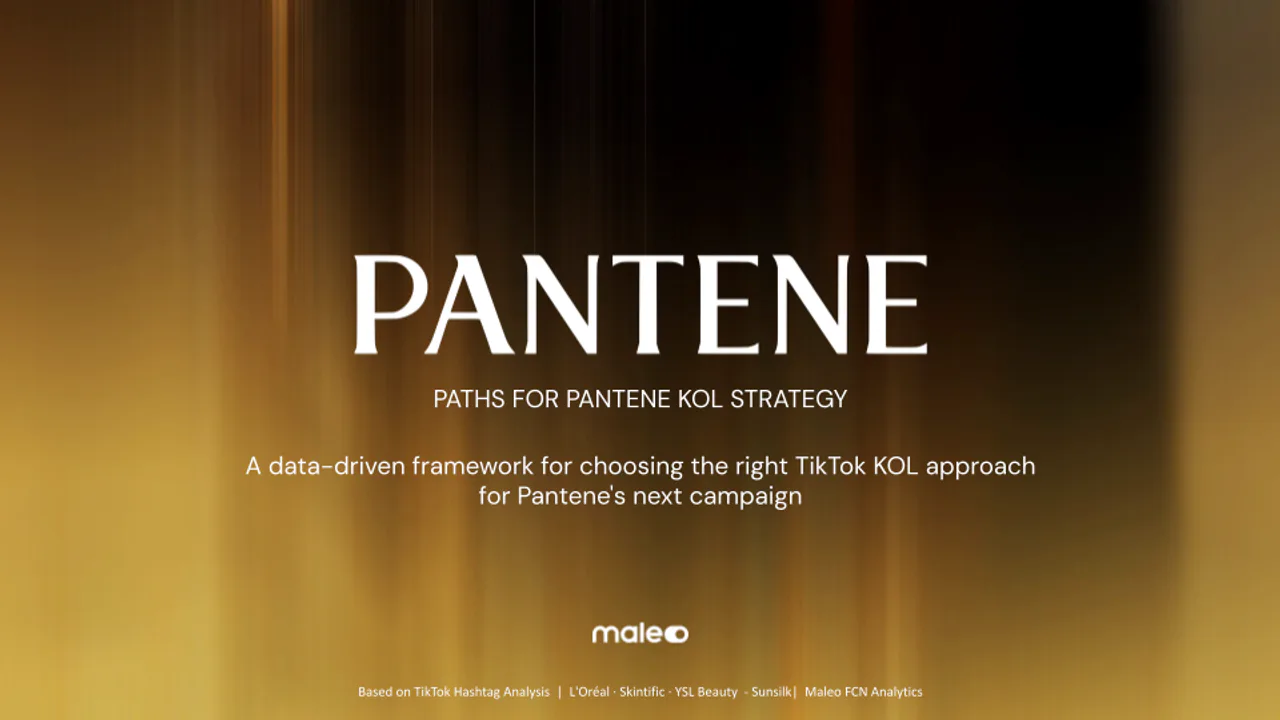
Gold and black cover of the Pantene KOL strategy deck

PanteneAd hoc strategy2026

Pantene KOL Strategy Update

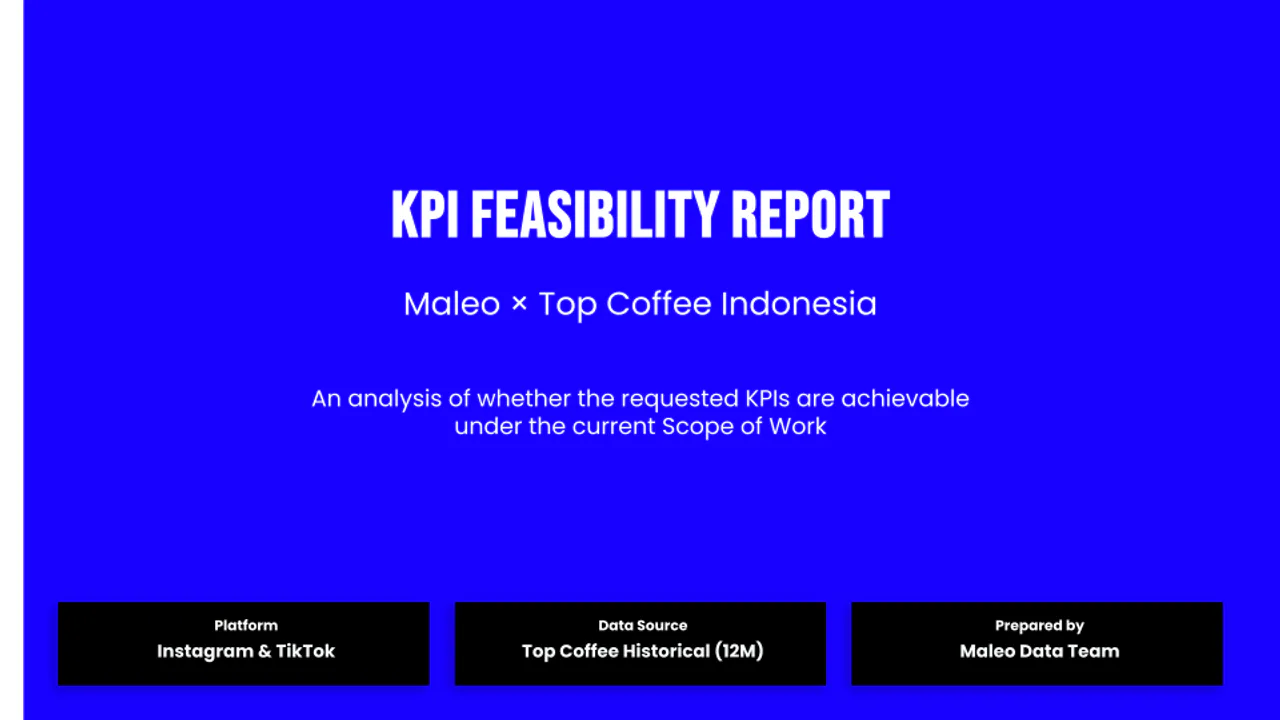
Blue cover of the Top Coffee KPI feasibility report

Top CoffeeAd hoc2026

Top Coffee KPI Feasibility Report

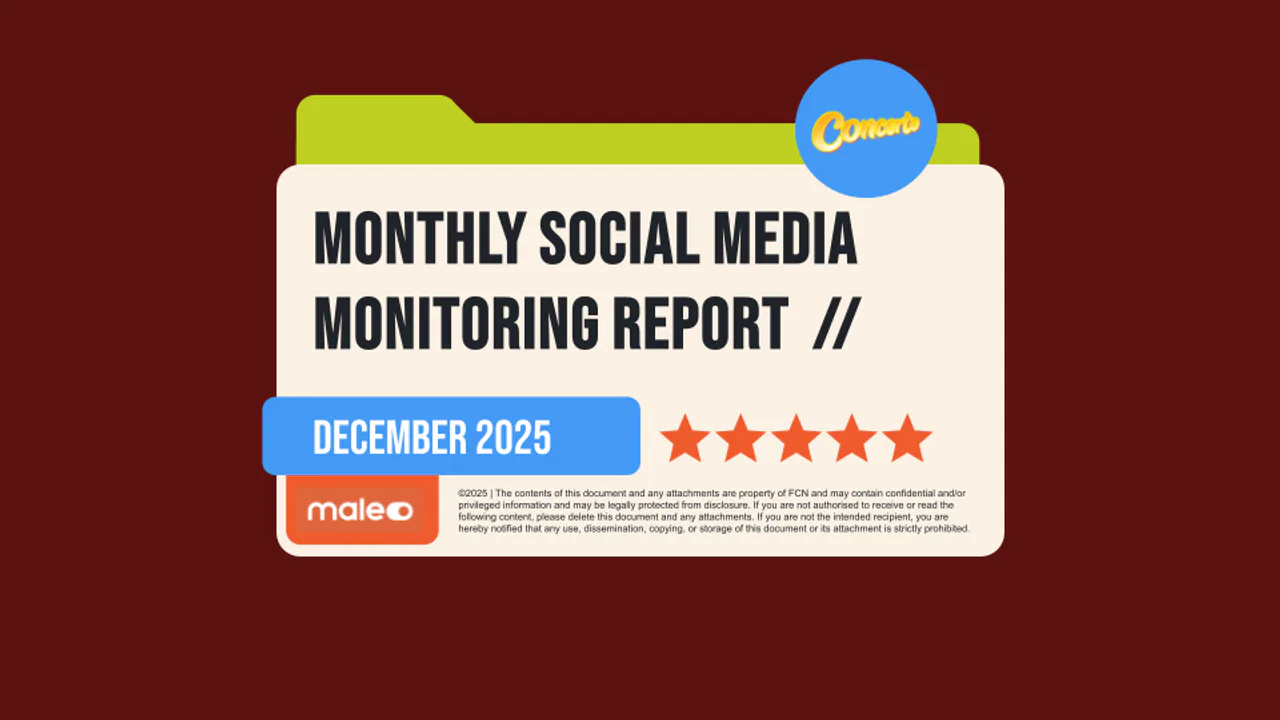
Burgundy cover of the Concerto December 2025 social media monitoring report

ConcertoMonthly retainer2025

Concerto Report — December 2025

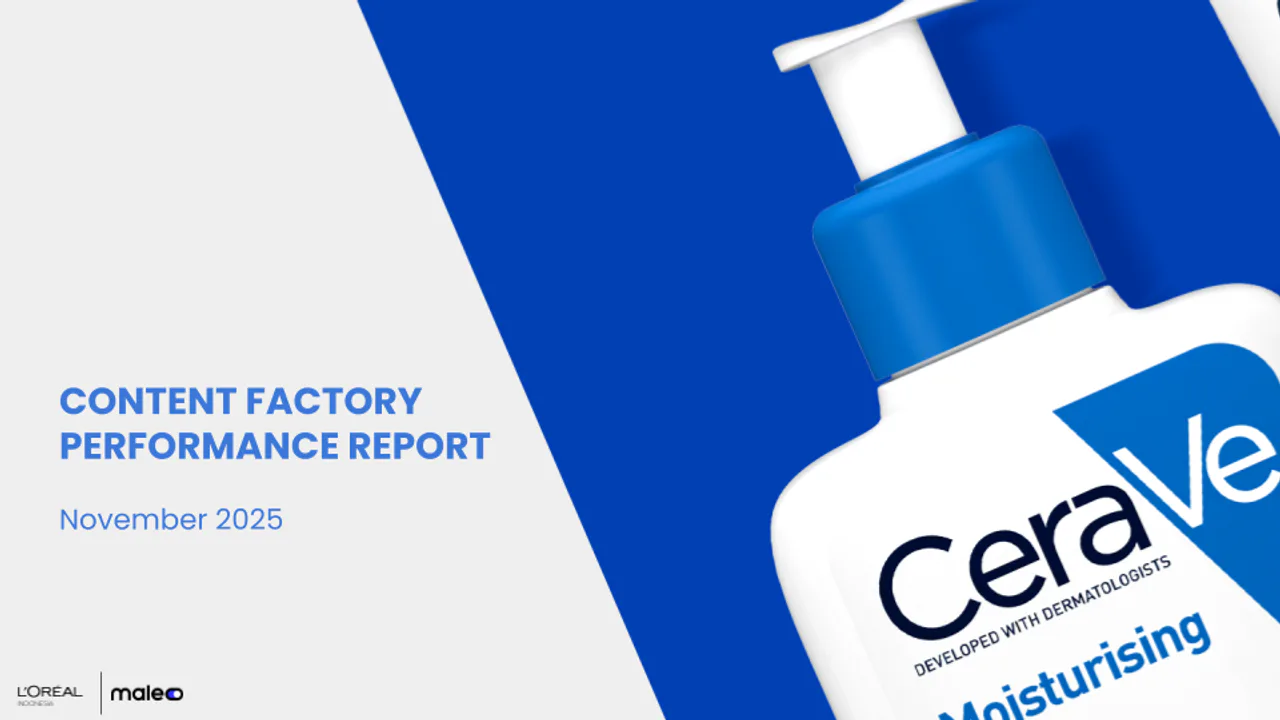
Blue and white cover of the CeraVe November 2025 content factory report

CRVMonthly retainer2025

CRV Maleo CF Report — November 2025

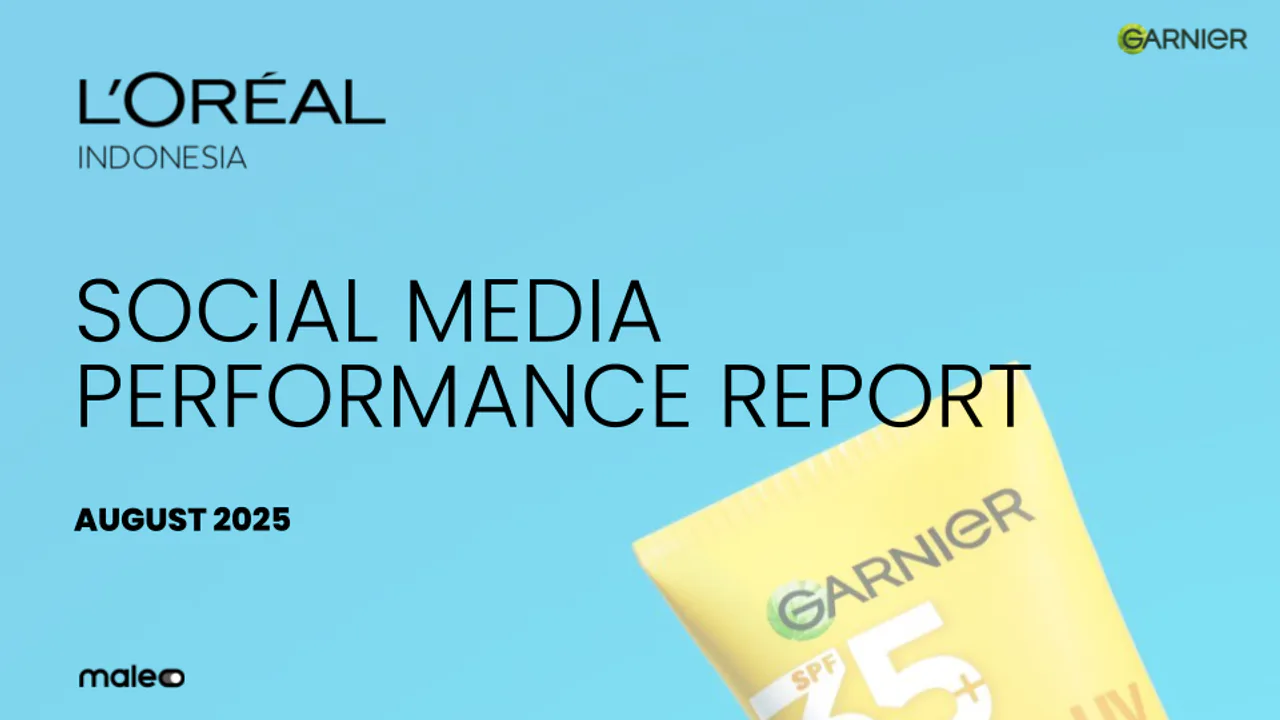
Light blue cover of the Garnier August 2025 social media performance report

GarnierMonthly retainer2025

Garnier Monthly Report — August 2025

L'Oréal Paris September 2025 social media performance report cover

OAPMonthly retainer2025

OAP Monthly Report — September 2025

Preview loads from Google Slides only after interaction and remains inside this website.

Approved Google Slides preview

Deck preview

Loading Google Slides preview...

This preview is served by Google. Close this window and try again if the embed is unavailable.

Domain referenceMetric dictionaryView definitions +
KOL
Key opinion leader monitored through dedicated scraping workflows.
KPI
Key performance indicator used as a dashboard benchmark.
Track score
Campaign-monitoring indicator shown alongside actual-versus-KPI views.
Data freshness
Whether scheduled reporting reflects sufficiently current source data.

Snapshot

Social-media reporting ran across five or more platforms, with raw data scattered across tools. As Lead Analytics Author, I led data preparation, analytical framing, insight synthesis, and production for more than 30 client-facing decks and reports across bi-weekly, monthly, quarterly, and yearly retainers, ad hoc requests, and pitch work. I also built a maintained pipeline that moved source data into automated spreadsheets, recurring reports, and dashboards so analysts could spend time on interpretation instead of manual preparation. Eight representative decks are published with permission; operating figures remain qualitative unless visible in those approved source decks.

The situation

Maleo manages social-media analytics for consumer brands. The work covered monthly reports, campaign reports, KOL (influencer) reporting, quarterly reviews, and ad-hoc social listening. Data lived across Instagram, TikTok, X/Twitter, Facebook, and YouTube, plus an internal ClickHouse warehouse.

The problem

Recurring preparation was repetitive and error-prone: pull the data, clean it, recompute KPIs, rebuild the same deck each cycle. Each brand also had its own report structure and stakeholder expectations, which made handover fragile.

The brands

Four FMCG brands anchored the workload. Names are shown with permission; all figures stay confidential.

Brand Primary report types Main channels
SilverQueen Monthly + campaign reports Instagram, TikTok
BlueBand Ad-hoc, campaign, quarterly, social listening Multi-platform
Pantene Campaign + KOL reporting Instagram, TikTok
TOP Coffee Whitelabel report supervision Multi-platform

The pipeline

The system moved data from source to decision signal through a maintained processing layer:
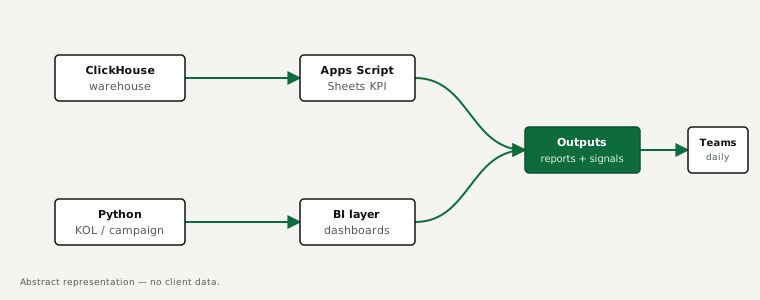
Abstract pipeline from data sources through processing to reports and daily decision signals. No client data.

  1. ClickHouse → Sheets. Apps Script pulled platform tables into brand workbooks on a daily schedule, refreshing content and follower tabs automatically.
  2. KPI workbook. Each workbook separated raw/update tabs from a master sheet that appended manual campaign fields, then computed standardized engagement metrics.
  3. Python scrapers. Notebook templates handled KOL and campaign pulls that the warehouse did not cover, with logging so errors could be traced.
  4. BI layer. Dashboards and recurring outputs consumed the cleaned tables.
  5. Decision signals. A chatbot delivered daily performance nudges to internal teams.

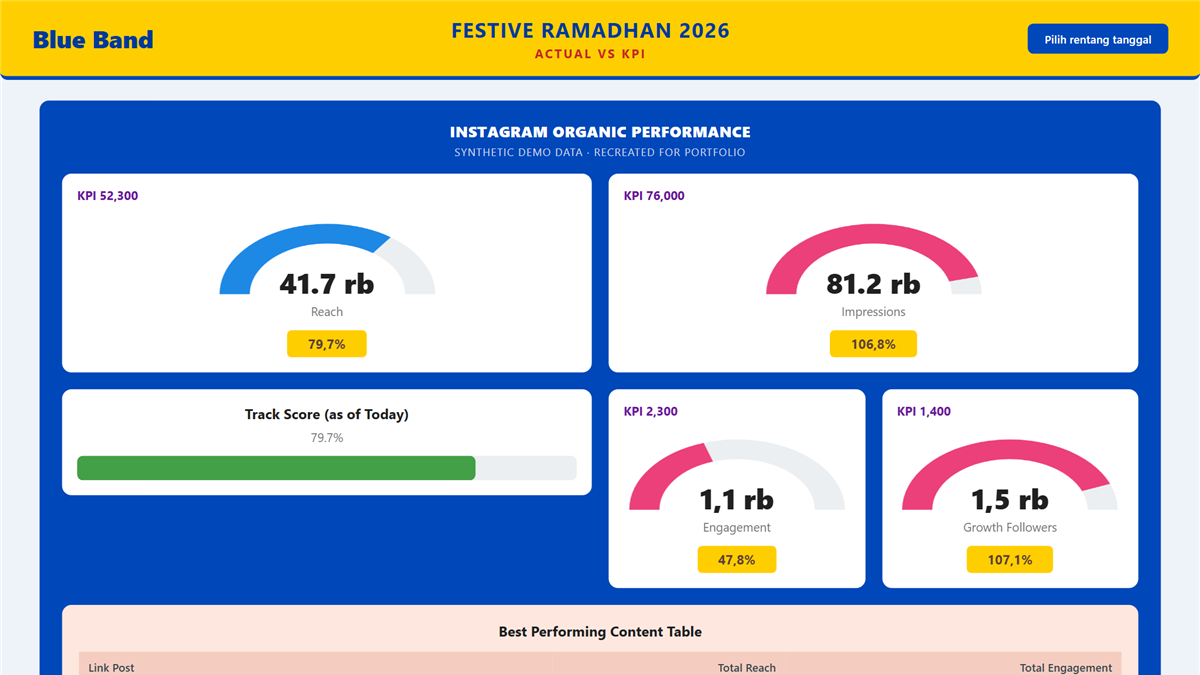
The BI layer surfaced campaign performance against KPIs as actual-vs-KPI gauges, a track score, phase and channel distribution, and best-performing content — the primary way marketing stakeholders consumed the pipeline’s output, replacing a manual slide-deck compile each week. The examples below are recreated with synthetic data.
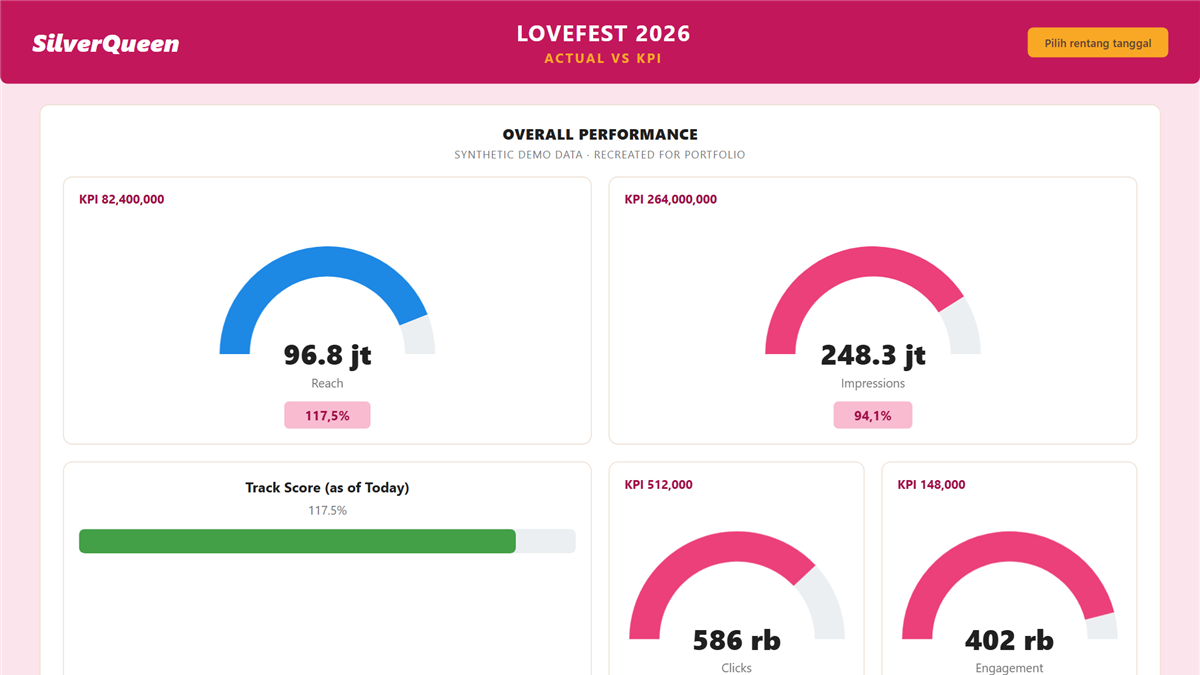
Campaign monitoring dashboard for a SilverQueen campaign, recreated with synthetic data, showing actual-vs-KPI gauges for reach and impressions, a track score, and best-performing content.

Campaign monitoring dashboard for a BlueBand campaign, recreated with synthetic data, showing Instagram organic performance gauges, a best-performing content table, and submission activity.

Technical patterns

The following are generic, sanitized templates. Placeholders mark anything that would reference a real brand, period, or credential.

SQL — followers growth template

-- Followers growth to the last recorded point per period
SELECT
  platform,
  DATE_TRUNC('month', captured_at)        AS period,
  MAX(followers)                          AS followers_end,
  MAX(followers) - MIN(followers)         AS followers_growth
FROM social_followers
WHERE brand = '<brand>'
  AND captured_at BETWEEN '<start_date>' AND '<end_date>'
GROUP BY platform, period
ORDER BY period, platform;

Apps Script — scheduled ClickHouse → Sheets refresh

// Credentials are read from Script Properties, never hard-coded.
function refresh_<brand>_tabs() {
  const props = PropertiesService.getScriptProperties();
  const conn = {
    host: props.getProperty('CH_HOST'),
    user: props.getProperty('CH_USER'),
    password: props.getProperty('CH_PASS'),
  };
  run_query_into_sheet(conn, SQL_IG_CONTENT,   'update_ig');
  run_query_into_sheet(conn, SQL_TT_CONTENT,   'update_tiktok');
  run_query_into_sheet(conn, SQL_IG_FOLLOWERS, 'ig_followers');
}

function create_daily_trigger() {
  ScriptApp.newTrigger('refresh_<brand>_tabs')
    .timeBased()
    .everyDays(1)
    .atHour(9)          // morning refresh, local time
    .create();
}

Python — KOL / campaign pull pattern

# Cookies/tokens are loaded from a local file that is never committed
# or sent with the output. Each run appends to a scrape_log for tracing.
def scrape_kol_posts(post_urls: list[str]) -> pd.DataFrame:
    rows, scrape_log = [], []
    for url in post_urls:
        try:
            media = fetch_media(url)            # platform-specific fetch
            rows.append({
                'url':       url,
                'views':     media.views,
                'likes':     media.likes,
                'comments':  media.comments,
                'shares':    media.shares,
            })
        except Exception as exc:                # keep going, log the gap
            scrape_log.append({'url': url, 'error': str(exc)})
    df = pd.DataFrame(rows)
    df['engagement_total'] = df[['likes', 'comments', 'shares']].sum(axis=1)
    df['er_by_views']      = df['engagement_total'] / df['views']
    return df

Quality-control standards

  • Metric definitions are explicit. Every report documents how engagement rate is computed — whether divided by reach, impressions, views, or followers — because the platforms disagree.
  • Organic and paid stay separate before any total is produced.
  • Freshness checks confirm each pull reached the expected cut-off before a report is built.
  • No credentials in artifacts. Passwords, tokens, and cookies live in a credential vault or Script Properties, never in notebooks, sheets, or decks.

Outcome

The pipeline reduced repetitive manual reporting across the brands, improved consistency of recurring monthly and campaign outputs, and gave teams timely daily signals for performance discussions. No unverified time-saving figure is published.

What I learned

Automation is only useful when KPI definitions, freshness checks, and escalation paths are equally clear. The reusable asset is not any single script — it is the documented pattern that lets the next analyst rerun the whole workflow without reverse-engineering it.

Outcome Validated evidence

What changed.

Published outcomes stay within what can be supported by project evidence.

Reduced repetitive manual reporting across brands

Improved consistency of recurring monthly and campaign outputs

Created timely daily signals for performance discussions

Contact Continue the conversation

Want to discuss how this system was built?