Snapshot
NEXUS is an internal business-intelligence platform I built at Skintific to replace scattered, analyst-built reporting with a single governed interface. Commercial, marketing, and operations teams use it to explore the data warehouse, build dashboards, and monitor performance without writing SQL — while every query stays inside role- and brand-level permissions.
The situation
The company ran on a BigQuery data warehouse, but most teams could not query it directly. Every recurring question — sales by category, channel performance, stock health — went through an analyst, who pulled the data, built the chart, and sent it back. The same definitions were recomputed differently across teams, and access to sensitive brand or channel numbers was hard to control once an extract was shared.
The problem
Reporting was a bottleneck and a governance risk:
- Analyst-dependent. Routine questions waited on an analyst’s queue, slowing decisions.
- Inconsistent definitions. “Sales” or “WOI” meant different things in different decks because each was computed by hand.
- No row-level control. Once a spreadsheet was exported, there was no way to restrict it to a user’s allowed brands or channels.
- Opaque data quality. Teams could not tell whether a dashboard was fresh or stale without asking.
What I built
A standalone Google Apps Script web app backed by BigQuery, organized as a single-page application with a governed semantic layer:
- Visual query builder. Users pick a business model, dimensions, metrics, and a date range; a server-side compiler generates parameterized SQL, so non-technical users get correct queries without touching code.
- RBAC + row-level security. Roles (admin, analyst, viewer) gate actions, and brand/channel scopes are enforced on every query — a user only ever sees the slices they are permitted to see.
- Executive dashboard hub. A responsive grid of Chart.js cards (bar, line, pie, scorecard, table) with global filters, drill-through, and CSV export.
- Sales extrapolation engine. A server-side post-processor that scales incomplete month-to-date data toward closing targets per brand, channel, and account, so pacing discussions use like-for-like projections.
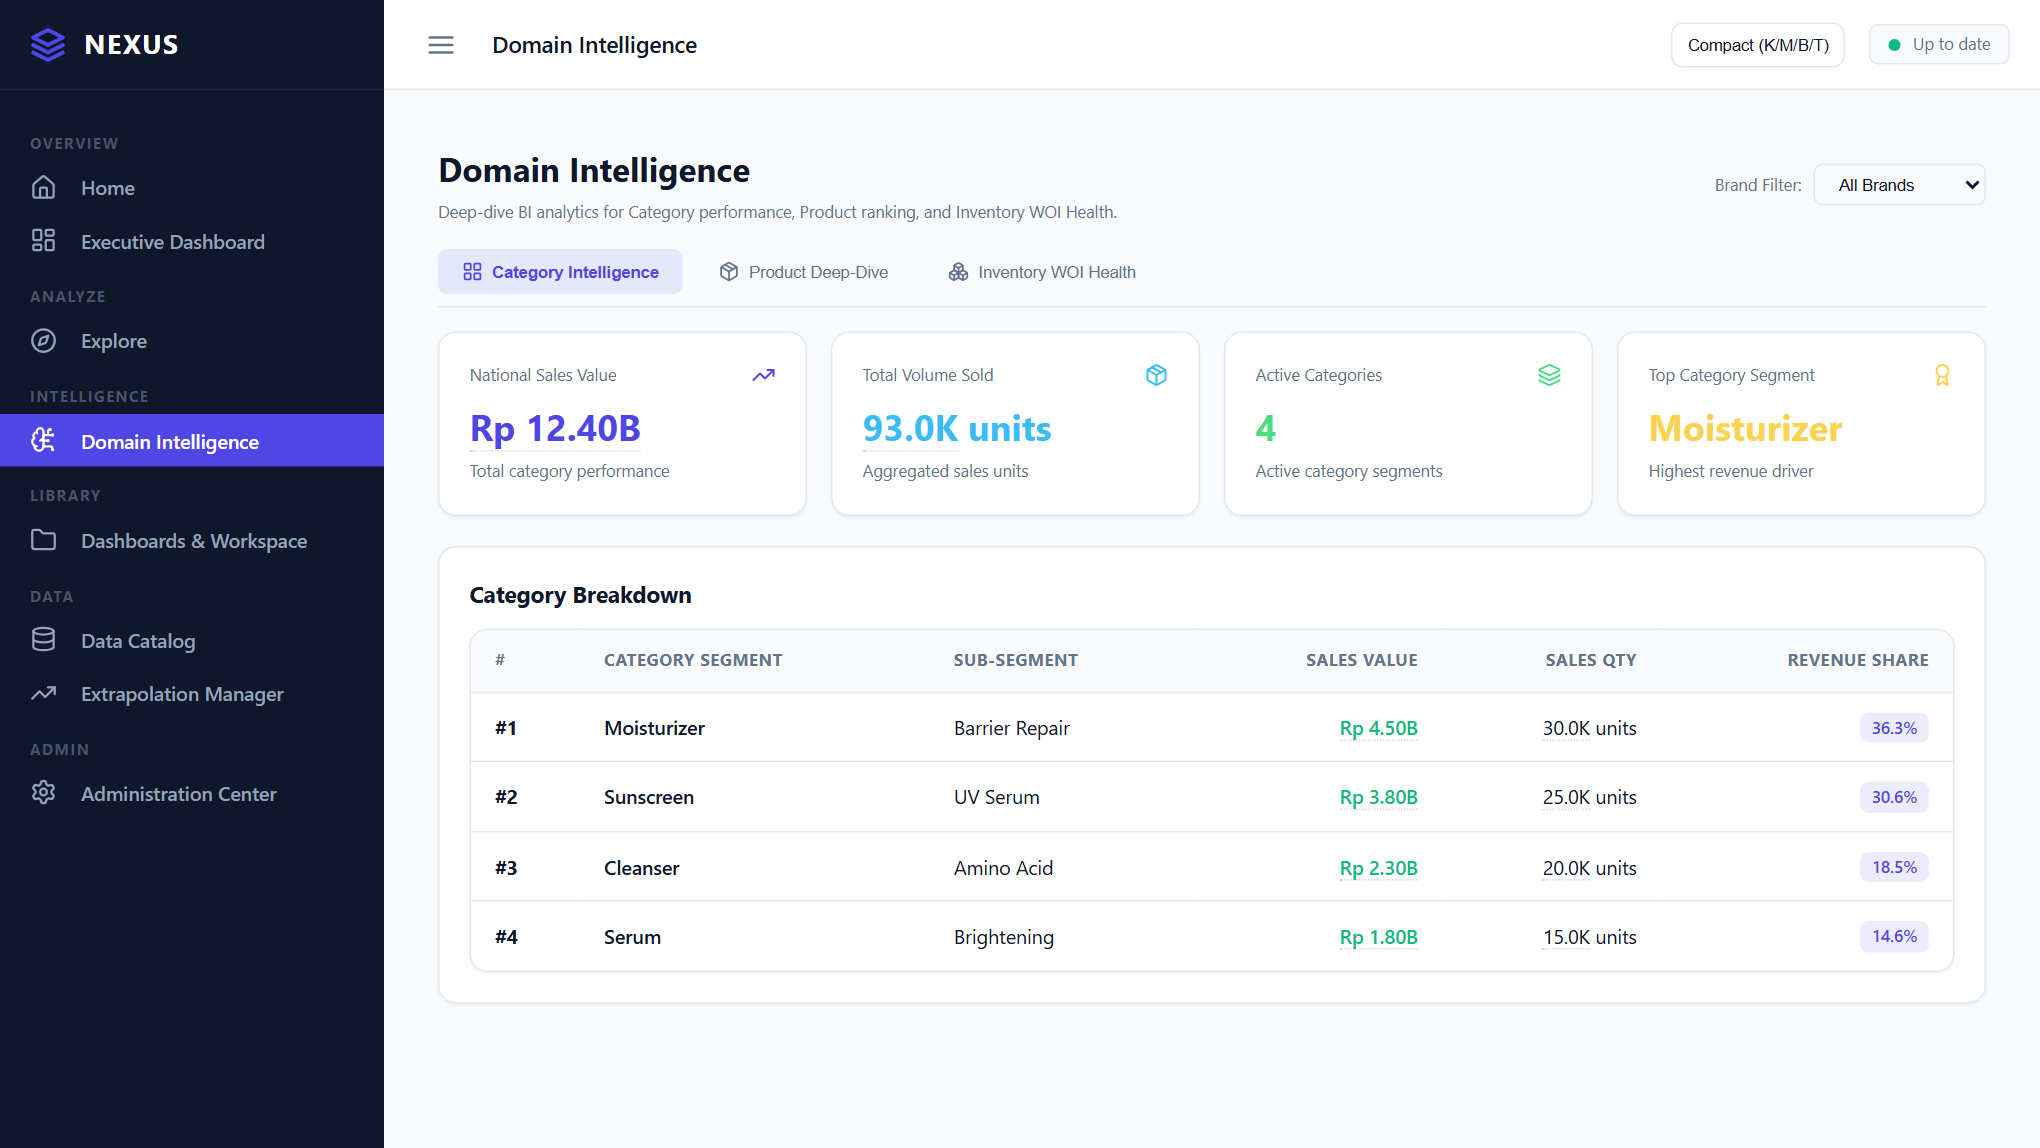
- Domain intelligence. Category intelligence, product ranking, and a stock WOI (weeks-of-inventory) health scorecard that flag slow-moving and at-risk inventory.
- Admin center. User and scope management, query audit logs, and a data-quality / freshness scorecard so the platform is observable.
// Sanitized: the server compiles only whitelisted models/dimensions/metrics
// and injects the caller's row-level scopes into every query.
function compileQuery(request, userContext) {
  const model  = Catalog.getModel(request.modelId);          // governed semantic layer
  const dims   = request.dimensions.map(d => model.dimension(d)); // throws if unknown
  const mets   = request.metrics.map(m => model.metric(m));
  const scopes = ScopeService.forUser(userContext.email);    // brand/channel RLS
  return QueryCompiler.build({ model, dims, mets, scopes }); // parameterized SQL
}
The companion stock data model (BigQuery views that reconcile warehouse, distributor, and in-transit stock into WOI and alert status) is published separately — see the linked repository.
Technical patterns
- Governed semantic layer. A catalog of models, dimensions, and metrics defines every allowed field, so the UI can never reference an arbitrary column.
- Parameterized compilation. All user input becomes bound parameters; the compiler is the only path to SQL, which keeps injection and scope-bypass out of reach.
- Config-as-data. User profiles, scopes, extrapolation rules, and dashboard layouts persist in a config spreadsheet, so the app needs no separate database.
- Auditability. Query audit logs and a freshness scorecard make both usage and data quality inspectable.
Outcome
The platform centralized governed access to warehouse data, let non-technical teams self-serve routine analysis instead of waiting on an analyst, and made KPI definitions consistent across teams because they are computed in one governed layer. Specific adoption and time-saving figures are withheld as internal.
What I learned
Self-serve BI succeeds or fails on governance, not on charting. The hard part was not rendering a dashboard — it was defining a semantic layer and row-level security tight enough that the business trusted people to explore on their own. Once definitions and permissions live in one place, the visualization is the easy part.