Snapshot
This project-based internship designed a reporting workflow across sales, customer, and product data, from a composite transaction key to aggregate views and dashboards.
The situation
Commercial reporting needed consistent integration of transaction, customer, and product data.
The problem
The sales table did not contain one unique column, so reporting grain and joins required deliberate design.
My responsibility
I designed the sales-item data model, aggregates, performance views, and reporting output for the project.
Approach
- Defined a composite key from invoice and item identifiers.
- Designed a base table at sales-item granularity.
- Designed aggregates by date, customer, and invoice.
- Proposed location and weather enrichment for demand analysis.
Solution
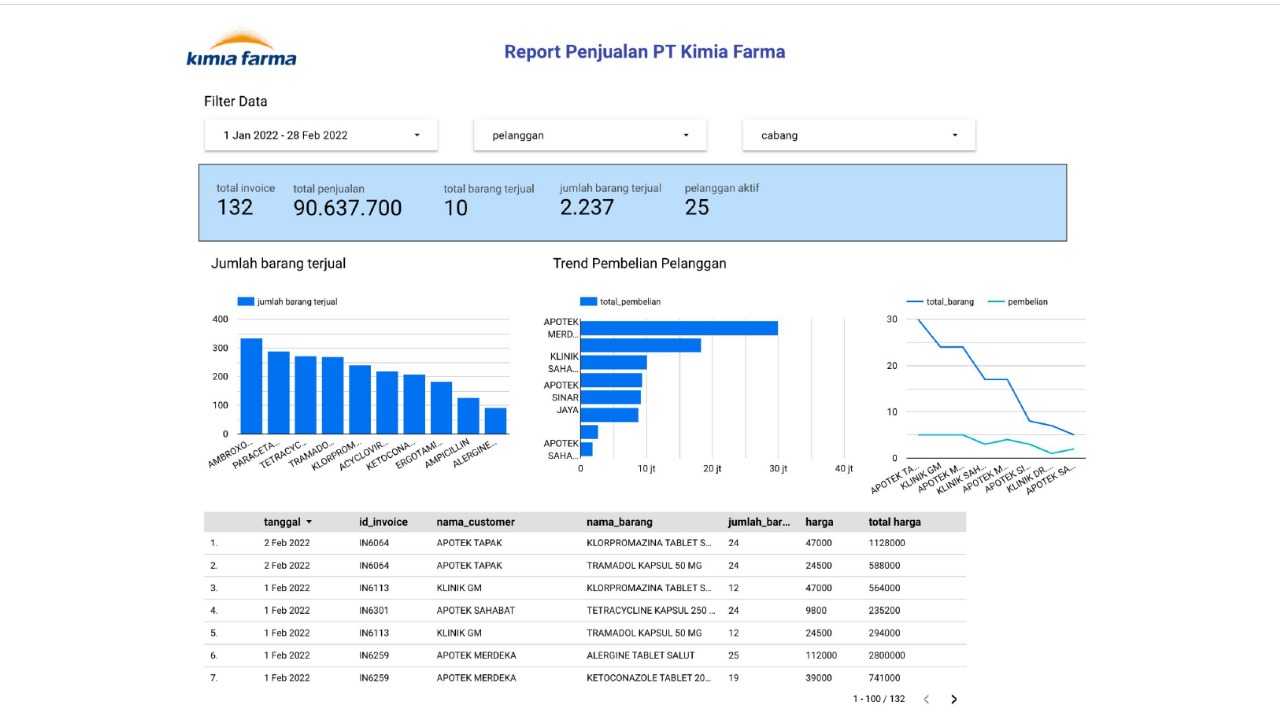
The datamart established a consistent sales grain and fed dashboard views intended to make commercial reporting clearer.
Outcome
The deliverable included table designs, performance views, and dashboard outputs. A supplied claim of 20% reporting-efficiency improvement is not published because its measurement method is undocumented.
What I learned
Reliable dashboards begin with grain, keys, and join behavior. Enrichment should be added only when its analytical purpose and data quality are clear.